AI Cosplay Generator - Transform Photos into Anime Characters
- September 24, 2025
Table of Contents
AI Cosplay Generator Overview
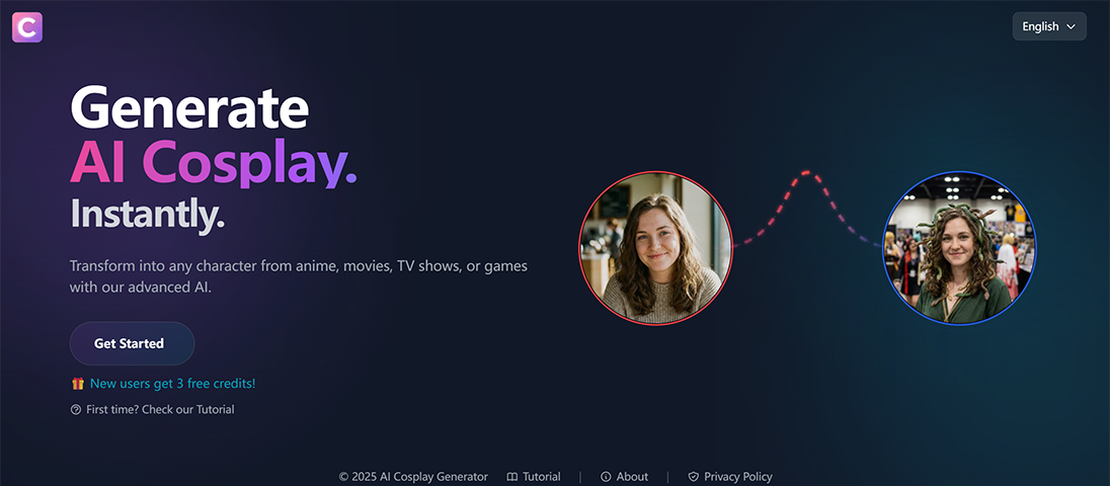
AI Cosplay Generator is an innovative AI-powered cosplay image generation tool that transforms your photos into stunning anime character cosplay effects. Simply upload your photo, choose from a curated library of anime characters, and let advanced AI technology blend your image with the selected character to create realistic cosplay results.
Why AI Cosplay Generator Matters
Creating professional cosplay images traditionally requires expensive costumes, makeup, and photography. AI Cosplay Generator removes these barriers by leveraging cutting-edge AI technology to generate high-quality cosplay effects from ordinary photos. Whether you’re a cosplay enthusiast, content creator, or simply curious about how you’d look as your favorite anime character, this tool makes the transformation instant and effortless.
Key Features for Cosplay Enthusiasts
- Photo Upload & Cropping: Support for multiple image formats with a built-in cropping tool for perfect framing.
- Character Library: Pre-set male and female anime character collections, plus support for uploading custom reference images.
- AI-Powered Generation: Advanced AI technology seamlessly blends user photos with selected characters for realistic effects.
- Credits System: Integrated Stripe payment system allows users to purchase credits for image generation.
- Secure Authentication: Clerk integration provides safe and seamless login/registration experience.
- Multi-Language Support: Available in Chinese, English, Japanese, French, and Spanish.
- Responsive Design: Perfectly optimized for both mobile and desktop devices.
Technology & Design Excellence
Built with React 19.2, TypeScript 5.8, and Vite 6.2, AI Cosplay Generator features a cyberpunk aesthetic with neon gradient colors, smooth animations, and modern glassmorphism effects. The mobile-first responsive design ensures a seamless experience across all devices.
Quick Start Guide
- Visit the AI Cosplay Generator landing page to learn more about the tool.
- Navigate to the
/cosplay/appworkspace to start creating your cosplay images. - Upload your personal photo, which will be automatically optimized to WebP format for best performance.
- Use the built-in cropping tool to adjust your photo for optimal results.
- Choose from the pre-set character library or upload your own custom character reference image.
- Click generate and let AI create your stunning cosplay transformation.
- Download and save your generated cosplay image.
Privacy & Security Assurance
AI Cosplay Generator prioritizes user privacy with secure authentication through Clerk. All user data is handled with care, and the platform provides transparent privacy policies accessible at /cosplay/privacy. The integrated payment system through Stripe ensures safe and reliable transactions.
AI Cosplay Generator brings the magic of anime cosplay to everyone, transforming ordinary photos into extraordinary cosplay creations with the power of AI.